Real-Time Dam Levels
Across Australia

Track water storage, capacity and historical trends for major reservoirs in New South Wales, Victoria, Queensland and beyond.

57.7% National average
303 Dams tracked
87,729 GL Total capacity
04 Jun 2026 Last Updated
Wingecarribee Water Level

Wingecarribee Water Level

New South Wales · Sydney
Reviewed by Water Resources Analyst
Hydrological Summary: Wingecarribee currently stores 98.8% of its total 26 GL capacity. Located in NSW and operated by WaterNSW, it is a critical water source for regional supply and irrigation.
Data officially sourced and updated from New South Wales water authorities. Last dataset update: 2026-06-02 00:00:00
Current Storage Level 98.8%
Total Capacity
26 GL
Status
Normal / Safe
Operator
WaterNSW
Last Updated
02 Jun 2026
Live Weather
10°C Partly cloudy
Rain: 0mm | Hum: 64%

Water Level Analysis

Wingecarribee is currently operating near maximum storage limits. With current readings at 98.8%, the reservoir holds a robust 26 GL. This provides immense water security for the New South Wales region.

Catchment & Hydrological Impact

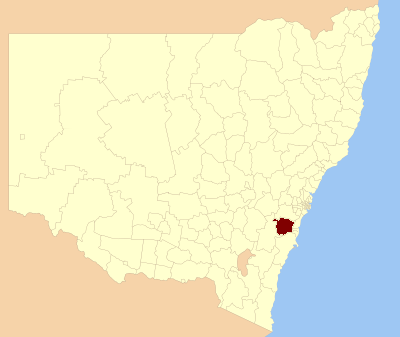
Fed primarily by the Wingecarribee River, this reservoir plays a critical role in the South East Coast (NSW) drainage division. Managing the flow from the Wingecarribee River ensures that downstream agricultural zones receive consistent supply. The South East Coast (NSW) region relies heavily on the seasonal inflows captured here.

Agricultural & Economic Significance

Beyond standard municipal supply, Wingecarribee is a vital asset for the regional agricultural economy in New South Wales. Irrigation allocations are directly tied to these storage metrics. Without the buffer provided by this massive 26 GL storage, regional farming would face extreme volatility.

Ecological & Recreational Context

Ecologically, the reservoir and its immediate wetlands serve as a crucial habitat for native Australian wildlife. During periods of healthy water levels, the area often sees an increase in recreational activities such as fishing, boating, and camping. Authorities must constantly balance the need for human water consumption with the ecological necessity of maintaining healthy river systems downstream.

Current Weather & Evaporation Impact

With a mild reading of 10°C today, surface evaporation is significantly reduced, helping to preserve current volume. With 0mm of recent rainfall and partly cloudy skies, the catchment is relatively dry today.

Future Outlook & Monitoring

The Bureau of Meteorology's climate outlooks will play a pivotal role in predicting the future inflows for this catchment. Continuous telemetry and advanced hydrological modeling are employed to forecast storage changes. Given the unpredictable nature of Australia's climate, from La Niña flooding to El Niño droughts, maintaining a dynamic operational strategy for Wingecarribee is absolutely essential.

Location Map

Frequently Asked Questions

What is the current water level of Wingecarribee?
As of the latest official reading, the water level at Wingecarribee is at 98.8% of its total capacity.
Is Wingecarribee currently full?
Yes, Wingecarribee is virtually full at 98.8%.
What is the maximum water capacity of Wingecarribee?
When completely full (100%), Wingecarribee can hold up to 26 Gigalitres (GL) of water.
Where is Wingecarribee located?
This reservoir is a critical water storage facility located in the state of New South Wales, Australia.
How does the water level at Wingecarribee affect local agriculture?
Water levels dictate the irrigation allocations for surrounding farmlands. A healthy level of 98.8% ensures that local farmers have the necessary water security for their seasonal crops and livestock.
Who manages the data for Wingecarribee?
The data is sourced from official government authorities including the Bureau of Meteorology (BOM) and specific state water utilities.

Nearby Dams in New South Wales

Largest Reservoirs in New South Wales

Latest Water & Drought News

← Back to all dams