Water Level Analysis
Talbingo is currently operating near maximum storage limits. Standing at an impressive 97.9%, the total volume sits at 921 GL. Such elevated levels ensure uninterrupted supply for the surrounding catchments.
Catchment & Hydrological Impact
The Tumut River acts as the primary lifeblood for Talbingo, making it a cornerstone of the Murray-Darling Basin network. Managing the flow from the Tumut River ensures that downstream agricultural zones receive consistent supply. The Murray-Darling Basin region relies heavily on the seasonal inflows captured here.
Agricultural & Economic Significance
Agriculture in the surrounding areas of New South Wales depends heavily on the water security provided by Talbingo. The local economy, heavily rooted in agriculture, fluctuates in tandem with the health of this reservoir. Without the buffer provided by this massive 921 GL storage, regional farming would face extreme volatility.
Ecological & Recreational Context
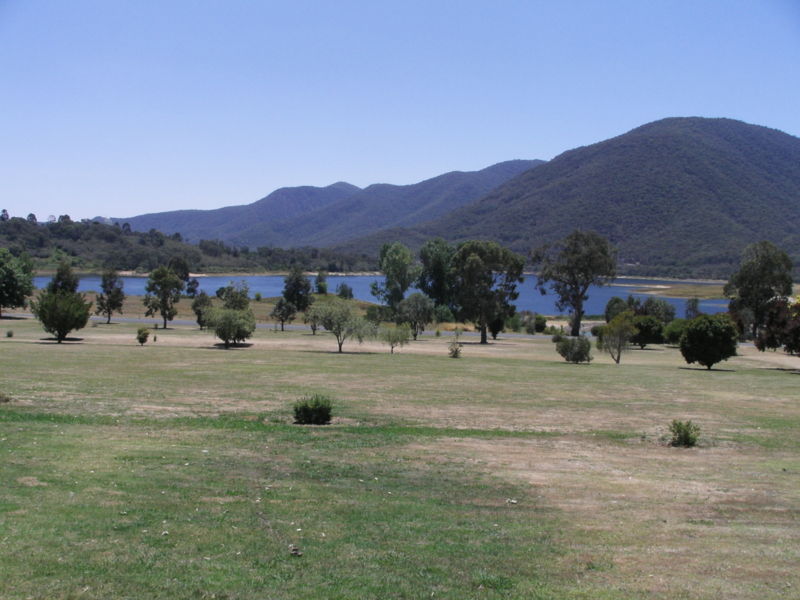
Ecologically, the reservoir and its immediate wetlands serve as a crucial habitat for native Australian wildlife. During periods of healthy water levels, the area often sees an increase in recreational activities such as fishing, boating, and camping. Authorities must constantly balance the need for human water consumption with the ecological necessity of maintaining healthy river systems downstream.
Current Weather & Evaporation Impact
The weather around the catchment is currently recording 19°C. Under current clear sky weather, there is no direct rainfall contributing to the immediate storage levels.
Future Outlook & Monitoring
The Bureau of Meteorology's climate outlooks will play a pivotal role in predicting the future inflows for this catchment. State water authorities utilize highly sophisticated monitoring tools to ensure every drop is accounted for. Given the unpredictable nature of Australia's climate, from La Niña flooding to El Niño droughts, maintaining a dynamic operational strategy for Talbingo is absolutely essential.