Real-Time Dam Levels
Across Australia

Track water storage, capacity and historical trends for major reservoirs in New South Wales, Victoria, Queensland and beyond.

57.7% National average
303 Dams tracked
87,729 GL Total capacity
04 Jun 2026 Last Updated
Millbrook Water Level

Millbrook Water Level

South Australia · Adelaide
Reviewed by Water Resources Analyst
Hydrological Summary: Millbrook currently stores 54.3% of its total 16 GL capacity. Located in SA and operated by SA Water, it is a critical water source for regional supply and irrigation.
Data officially sourced and updated from South Australia water authorities. Last dataset update: 2026-05-31 00:30:00
Current Storage Level 54.3%
Total Capacity
16 GL
Status
Normal / Safe
Operator
SA Water
Last Updated
31 May 2026
Live Weather
10°C Partly cloudy
Rain: 0mm | Hum: 77%

Water Level Analysis

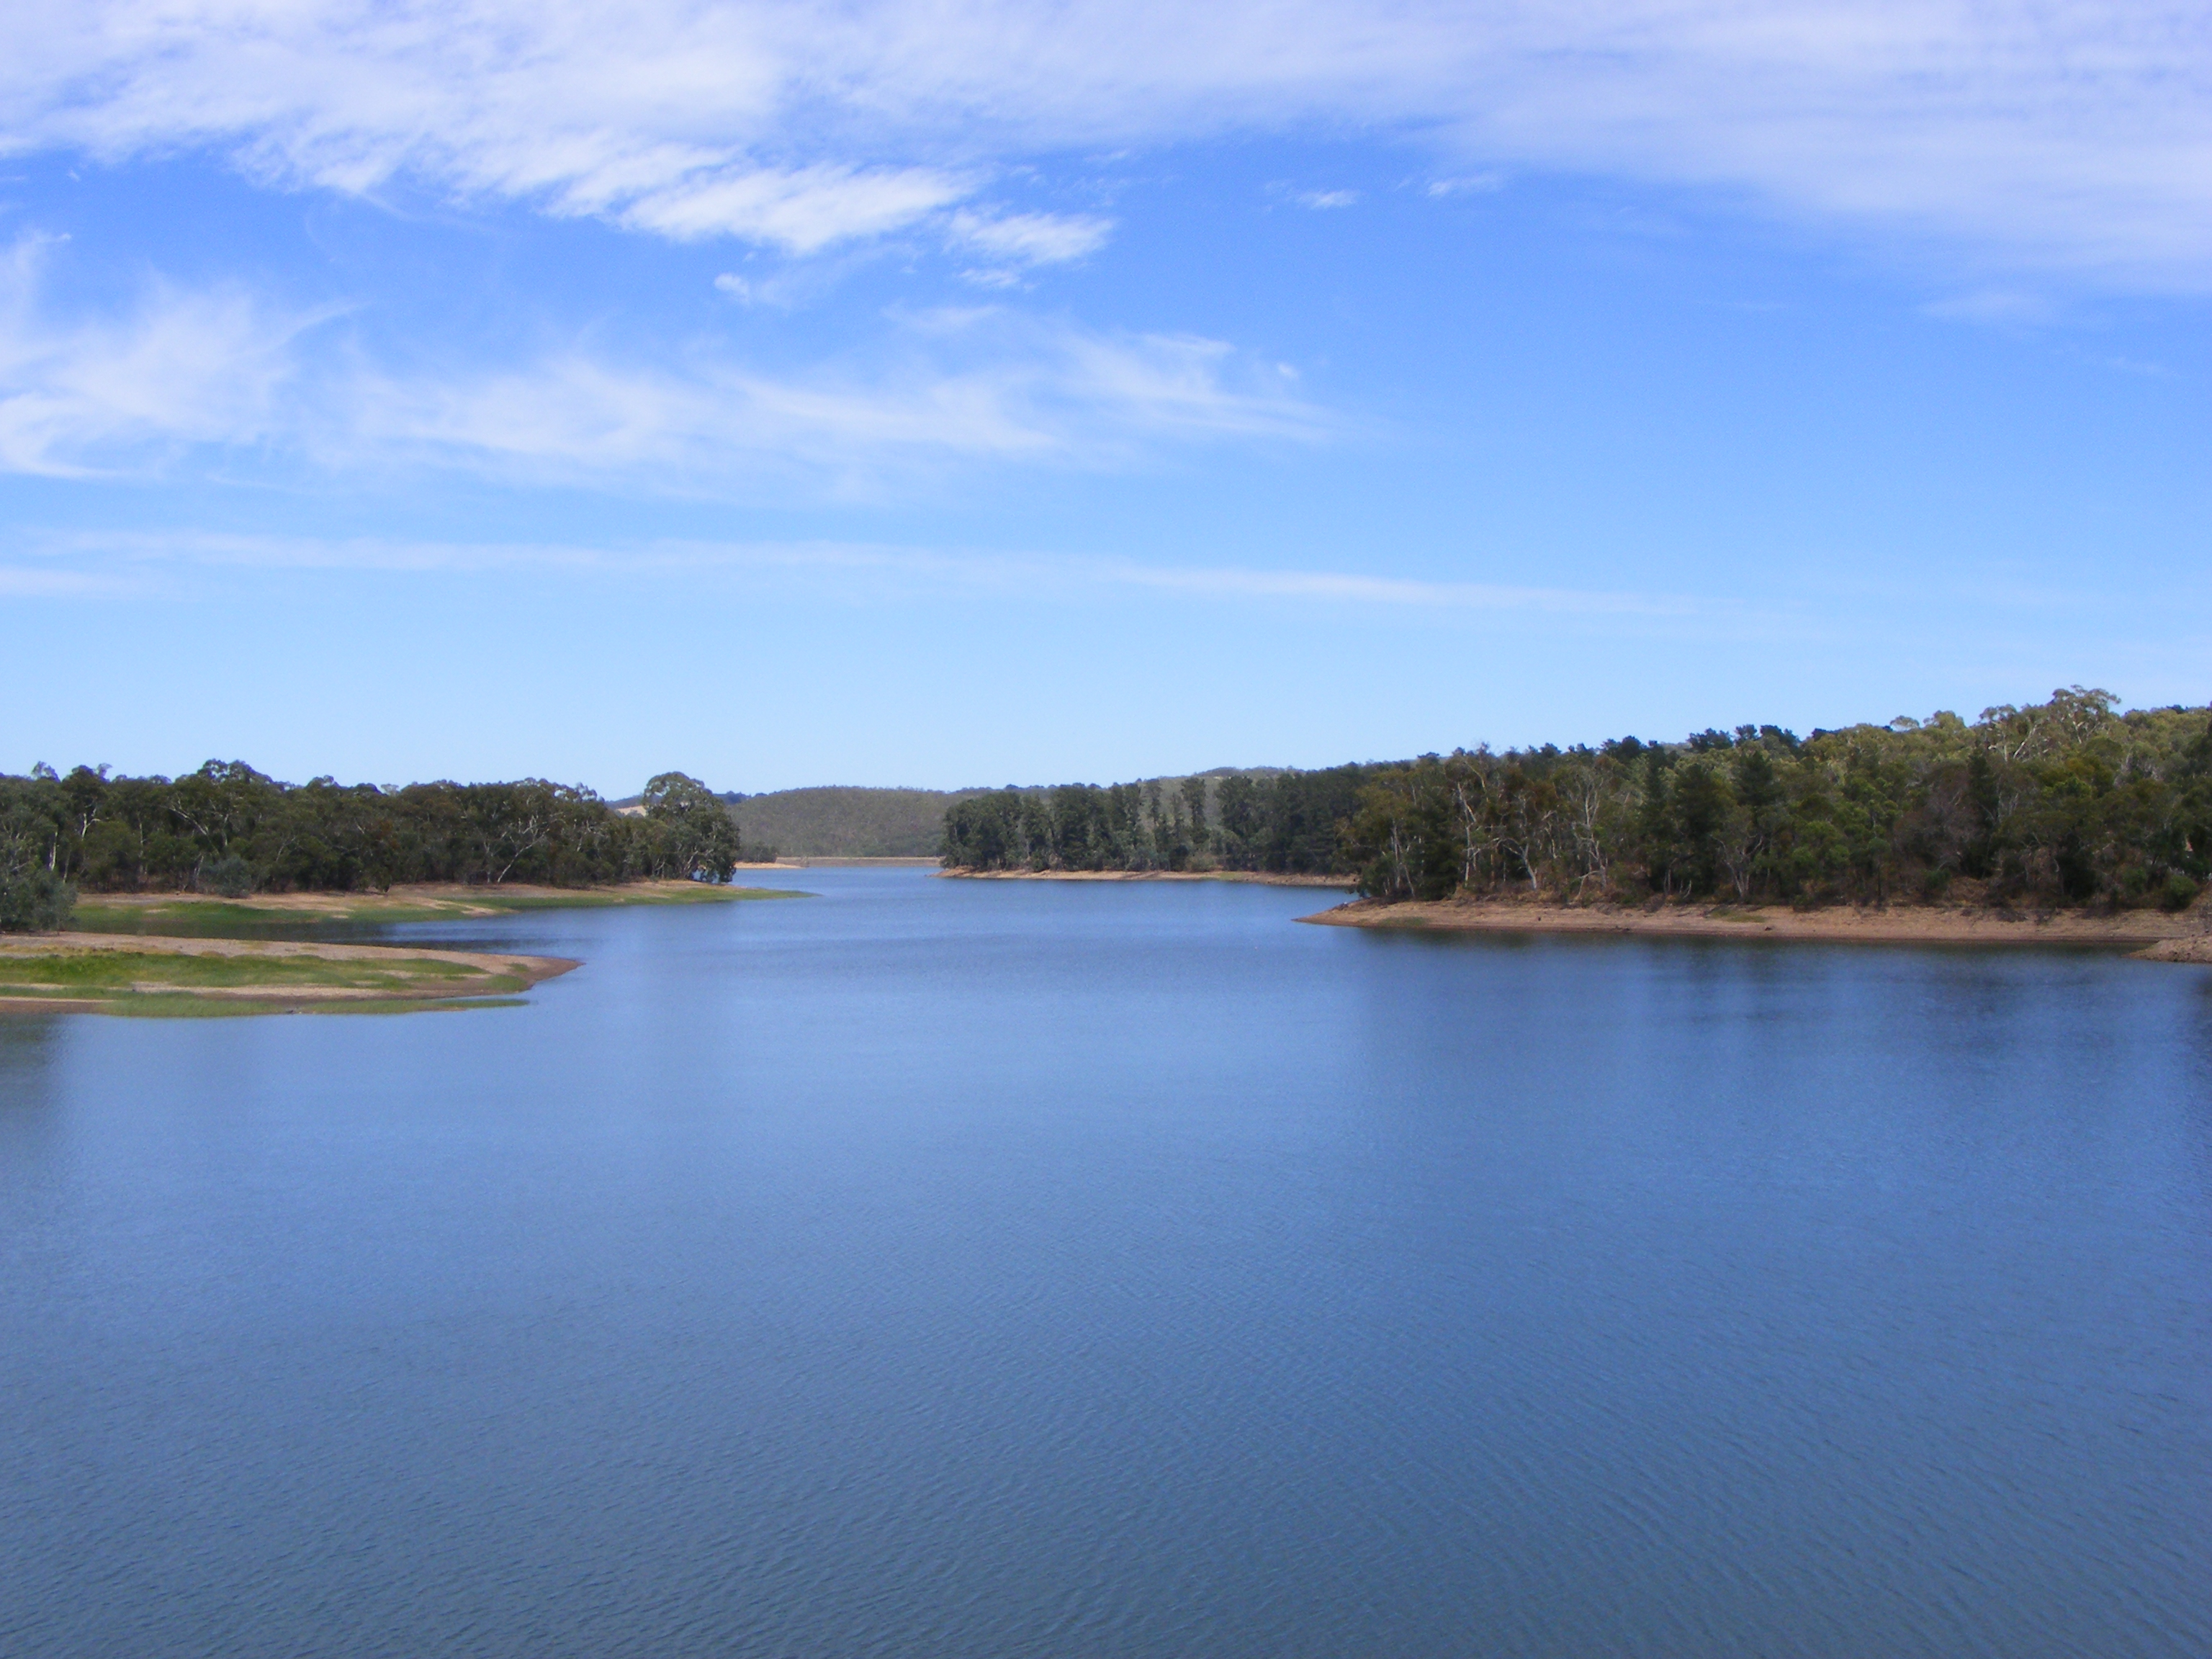
Storage levels at Millbrook are within moderate seasonal bounds. Sitting at 54.3%, the total stored volume is 16 GL. While adequate, continuous monitoring is standard procedure for this catchment.

Catchment & Hydrological Impact

Fed primarily by the River Torrens, this reservoir plays a critical role in the South Australian Gulf drainage division. Hydrological health in this specific drainage basin is vital for downstream ecosystems. Catchment dynamics in the South Australian Gulf are deeply influenced by the retention capacity of Millbrook.

Agricultural & Economic Significance

Agriculture in the surrounding areas of South Australia depends heavily on the water security provided by Millbrook. Farmers and agribusinesses monitor these levels closely to plan their seasonal crop yields. Without the buffer provided by this massive 16 GL storage, regional farming would face extreme volatility.

Ecological & Recreational Context

Ecologically, the reservoir and its immediate wetlands serve as a crucial habitat for native Australian wildlife. During periods of healthy water levels, the area often sees an increase in recreational activities such as fishing, boating, and camping. Authorities must constantly balance the need for human water consumption with the ecological necessity of maintaining healthy river systems downstream.

Current Weather & Evaporation Impact

Cooler current temperatures of 10°C help minimize evaporation losses across the reservoir. Under current partly cloudy weather, there is no direct rainfall contributing to the immediate storage levels.

Future Outlook & Monitoring

The Bureau of Meteorology's climate outlooks will play a pivotal role in predicting the future inflows for this catchment. State water authorities utilize highly sophisticated monitoring tools to ensure every drop is accounted for. Given the unpredictable nature of Australia's climate, from La Niña flooding to El Niño droughts, maintaining a dynamic operational strategy for Millbrook is absolutely essential.

Location Map

Frequently Asked Questions

What is the current water level of Millbrook?
As of the latest official reading, the water level at Millbrook is at 54.3% of its total capacity.
Is Millbrook currently full?
It is partially full, currently holding steady at 54.3%.
What is the maximum water capacity of Millbrook?
When completely full (100%), Millbrook can hold up to 16 Gigalitres (GL) of water.
Where is Millbrook located?
This reservoir is a critical water storage facility located in the state of South Australia, Australia.
How does the water level at Millbrook affect local agriculture?
Water levels dictate the irrigation allocations for surrounding farmlands. A healthy level of 54.3% ensures that local farmers have the necessary water security for their seasonal crops and livestock.
Who manages the data for Millbrook?
The data is sourced from official government authorities including the Bureau of Meteorology (BOM) and specific state water utilities.

Nearby Dams in South Australia

Largest Reservoirs in South Australia

Latest Water & Drought News

← Back to all dams