Water Level Analysis
Water levels at Barossa are well within positive historical averages. With a current fill rate of 93.2%, the reservoir contains 4 GL. This volume provides a solid foundation for both urban and agricultural demands across South Australia.
Catchment & Hydrological Impact
The Off-stream acts as the primary lifeblood for Barossa, making it a cornerstone of the South Australian Gulf network. Managing the flow from the Off-stream ensures that downstream agricultural zones receive consistent supply. Catchment dynamics in the South Australian Gulf are deeply influenced by the retention capacity of Barossa.
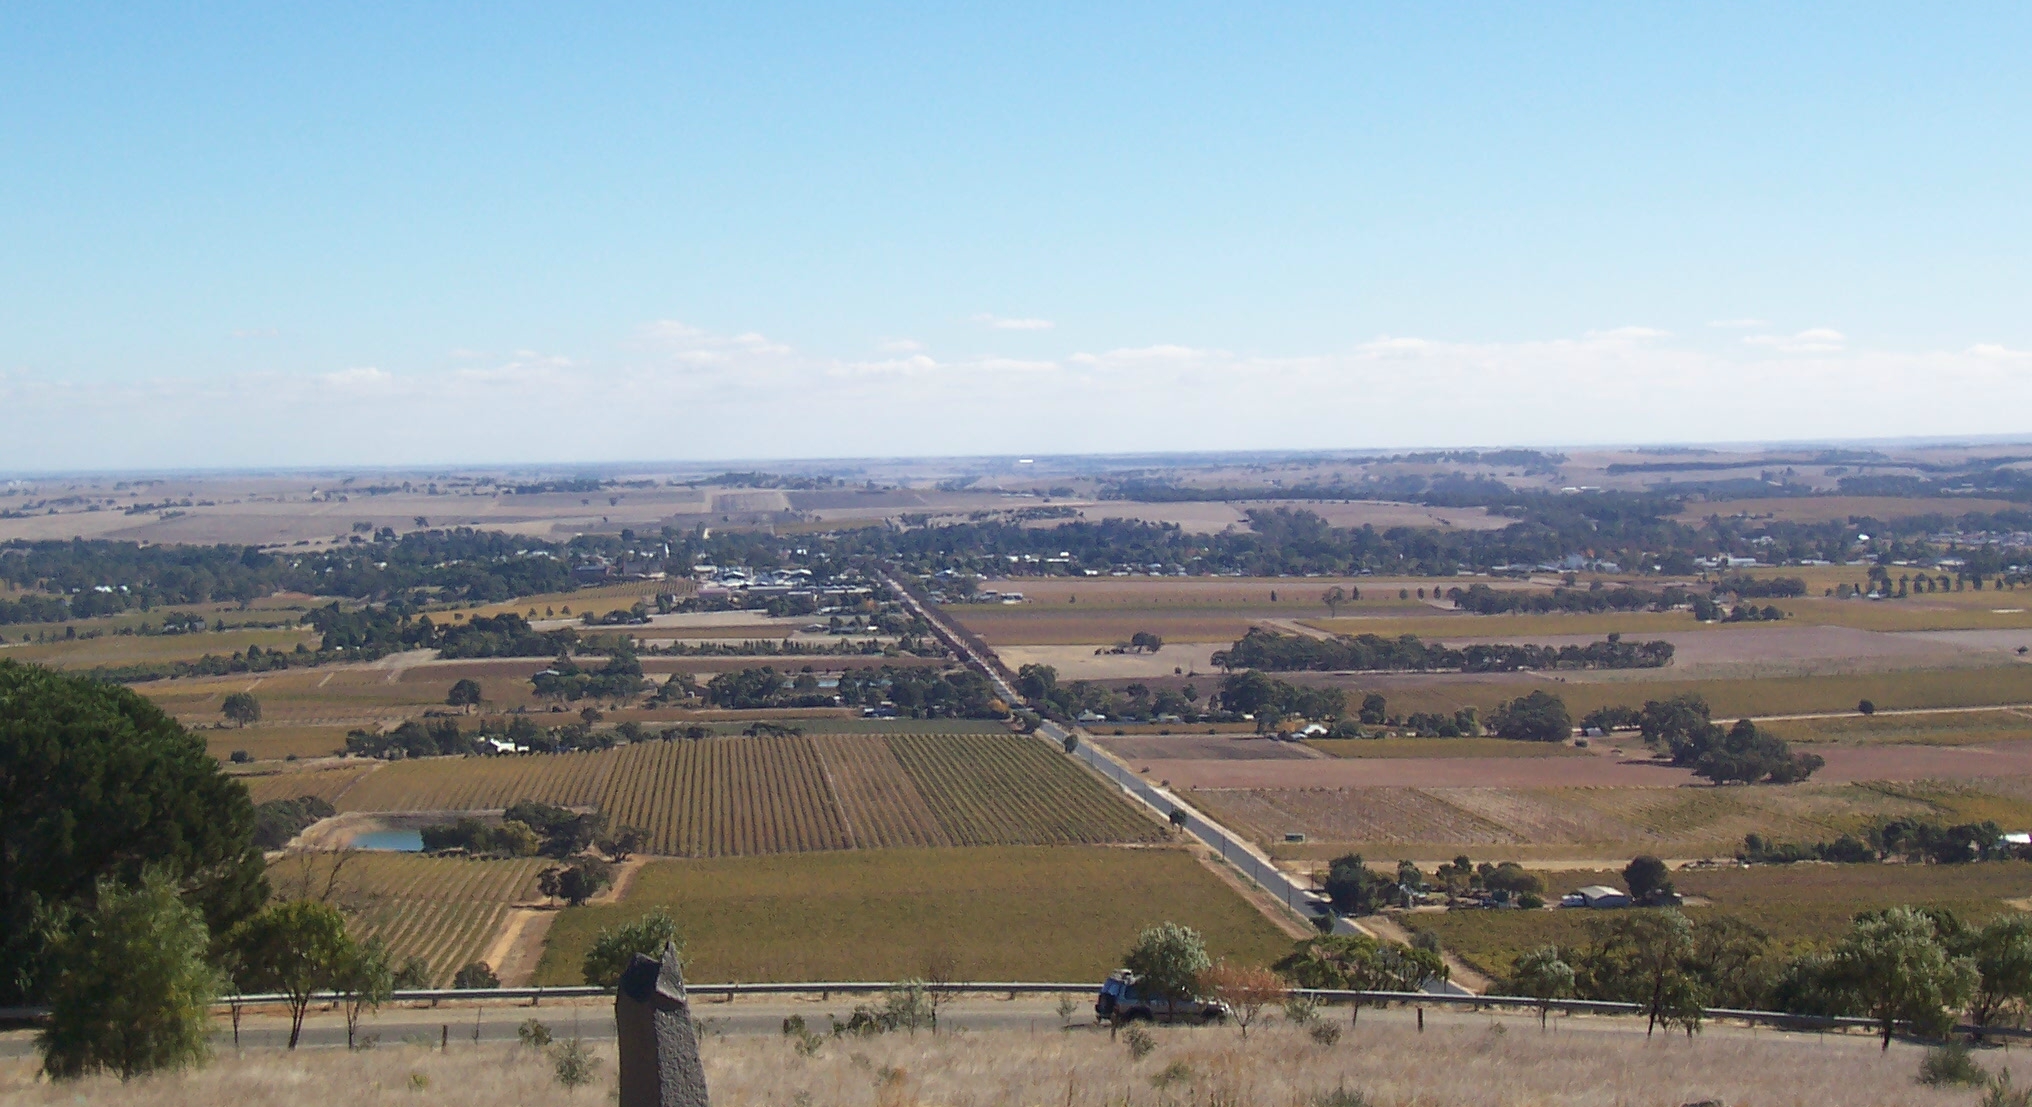
Agricultural & Economic Significance
Beyond standard municipal supply, Barossa is a vital asset for the regional agricultural economy in South Australia. The local economy, heavily rooted in agriculture, fluctuates in tandem with the health of this reservoir. Without the buffer provided by this massive 4 GL storage, regional farming would face extreme volatility.
Ecological & Recreational Context
The surrounding catchment of Barossa also supports diverse local flora and fauna. When capacity allows, Barossa becomes a hub for regional tourism and water sports. Authorities must constantly balance the need for human water consumption with the ecological necessity of maintaining healthy river systems downstream.
Current Weather & Evaporation Impact
Cooler current temperatures of 15°C help minimize evaporation losses across the reservoir. Currently experiencing partly cloudy conditions with no immediate precipitation, inflows remain entirely dependent on upstream river movement.
Future Outlook & Monitoring
The Bureau of Meteorology's climate outlooks will play a pivotal role in predicting the future inflows for this catchment. State water authorities utilize highly sophisticated monitoring tools to ensure every drop is accounted for. Resilience against extreme weather events remains the ultimate goal for the managers of this critical infrastructure.